Friday, November 16, 2012

UPDATE: AAPL ~ what's in store (next)? (Mar 4 2013)

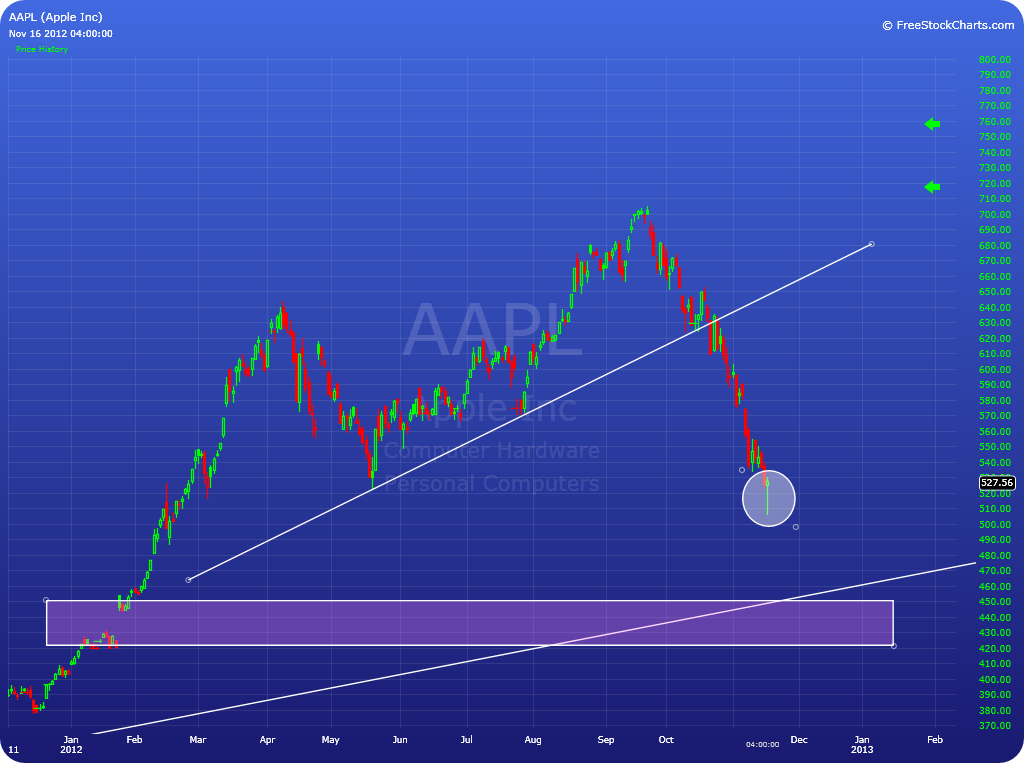
AAPL had been on a huge run.  Monstrous gains in a consistent and significant manner.  And their cash reserves continue to grow >$100B.  Their product placement and pipeline remain positive.  So where to from here?  Stock price has declined 25% from late September highs, and has a gap to close at $431.  Today, Seeking Alpha has a piece talking about the circumstances being ripe for AAPL to more fully monetize its patent portfolio > suggesting AAPL is about to realize it's full share potential?  You may notice the two green arrows, these were long price targets on a bounce off the original ascending trendline.  Didn't go there now did it?  Watching and Learning.  Trading On.

_________________________________________________________________________________

UPDATE 10:  AAPL has both been stronger and weaker in the period since the last update.  $419 has been touched twice thus far.  Analyst opinions are all over the map as to what is next.  I can't recall the last time I saw reference to what they were going to do with the mountain of cash they have socked away.  $50B/YR free cash flow ~ WOW ~ The no news of a dividend is curious.  I've  read Steve Jobs can still be credited for advancing the next two iPhones. That could be good.  iPhone 5 has not been a great winner.  iPad Mini has met expectations I believe.  Market uncertainty ~ global geopolitical uncertainty ~ growth uncertainty ~ be cautious!


UPDATE 9:  AAPL has continued with general weakness after retesting the support trend line above as resistance now.  My original target of $431 has been reached ~ protect all profits and principle ~ keep runners on if you choose.  Where to from here?


UPDATE 8:  AAPL has retreated from a trend line and (again) approached a 'gap' to close.  There has been lots of news on AAPL this past week ~ Einhorn and the shareholder vote related to changing the Articles of Incorporation, and the statement regarding more than 30% of AAPL's share value is in CASH (>$130B) ~ remember the statements a few months back, AAPL was going to be the first Trillion$ market cap company. With market sentiment seeing further downside, what will this mean to this Tech Titan? Watching and Learning.


UPDATE 7:  AAPL have rebounded and is up against a trend line and although having pierced this, it also retraced back below ~ is this a potential zone where the reversal may continue?  Watching and Learning.


UPDATE 6:  The daily chart for $AAPL is exhibiting a loose HS pattern > measuring to $380 and $280, first and second target respectively > with a good probability of a pause at $350-360.  This goes completely against the grain, but technically, this is a plausible pattern.  Watching and learning.


_________________________________________________________________________________

UPDATE 5:  Certainly any reference to a downside target of $431 (as stated above) was rebuked with a variety guffaws and uncontrolled laughter.  The low price realized thus far is $435 - close enough for the girls we go with.  Now the challenge will be the overhead resistance > and what that will do to price reversion.


UPDATE4:  price bounced from top range of gap to close @ $450/shr _ interesting to see the headline that still claims at this price AAPL is STILL not a buy.  They missed on earning, iPhone sales down - but don't they still have more than $120B in their private hedge fund? Watching and Learning.


UPDATE3:  the $431 gap close may be more realistic than originally contemplated?


UPDATE2:  price has had a healthy bounce, including a gap up (highlighted).  


UPDATE1:  a most interesting close to the day > could mean for some interesting price action for next week.


Thursday, November 8, 2012

UPDATE: SPX Daily Chart - What's Next?

UPDATE:  The S&P500 (SPX) has climbed to dizzying heights is a short period.  The previous high (2007) of 1576 is not that far off with last weeks high of 1530.  The path to these lofty prices has been mostly up, with a rocky start where mid-1300's were tested.  Another break of the uptrend line in Jan 2013 again saw further strength pushing the market forward.  This recent weakness takes price below the narrow steeper channel.  How meaningful that weakness is into the next weeks of trading will have to be measured carefully. Watching and Learning.


Monday, July 30, 2012

CLF Daily Chart 30-7-2012


UPDATE October 14, 2013: EOG Weekly Chart H&S 30-7-2012

I am generally a short term trader.  Be it that I don't trust the markets, or maybe just don't trust myself, I tend towards intra-day and short swing trades that are driven by technical analysis.

EOG came to my radar through trading room discussions back in July.  On the weekly chart - this issue seems well poised for a long term IHS measured move - a very significant move if realized to its full potential > full measured move to $172/shr.
_______________________________________________________________________________

UPDATE 14-October-2013
Stopped out 25% of position @$168 ~ remaining 75% now has stop @ $174/shr.  I think that the general market sentiment, and that of the energy services industry remains positive.


UPDATE 19-September-2013
This trade has continued to play out.  The final full measured target of $172 has virtually been achieved.  The last several days of trading have price surged up almost to target, and then came off slightly before bouncing into the close today.  I have continued with trailing stops ~ currently @ $168 ~ this has been a good trade.


UPDATE 29-August-2013
The second target of $161 has been achieved (161.47) - rejected - and achieved again (161.32) - and rejected again.  I think that regardless of its technical status, the oil and gas service business should remain strong, and continued growth in operations and revenues for EOG should remain positive.  Technically, we have a double top.  Trailing stop is at $145.  Watching and learning.  Trading on.


UPDATE August 3, 2013:  This trade has continued to perform well.  I have a strong interest further scaling in again as price breaks above previous highs.  I would like to see a test of the $150 level to confirm strength.  While it has fully closed the gap up over the trend line, price rise has been rather dramatic and likely would benefit from a pause.  Regardless of what happens, I continue with trailing stops.  We are approaching the full extent of the original trade.  Caution is front and center.  Watching and learning.  Trading On.


UPDATE: July 21, 2013:  It has been almost exactly a full year.  This trade has blown through the second target.  I removed 50% of my position @ $124, remaining 50% left to run (with a Trailing Stop).  Has oscillated above and below the trend line/floor of IHS and then gapped above, closed the gap, and has continued higher.  Closed the week @ $147.  I am leaning to the continued optimism side, at least through to the fall ~ unless things change dramatically ~ which they could.  In eighteen trading days, only three down days - maybe a pullback is in order ($142, $138)?  Regardless of the forward position, this has been a good trade.  Watching and Learning.

UPDATE (Jan 19, 2013): this issue has moved incredibly from my initial small position in the third week of July @$93/shr.  I have increased my position as the price has climbed and it has been a most rewarding trade.


With recent news suggesting that the oil and gas services sector is in for a run - this trade may well be one of if not my best trade ever.  Watching and Learning.