Saturday, November 9, 2013

Tuesday, October 29, 2013
Has your favorite coffee beverage gone down in price? (WSJ and FINVIZ)
Historically, coffee prices (ICO Composite Indicator) have been above $1.00/lb though through the 90's a new low was established at $0.41 in 2001 and stayed low through 2004 before accelerating and peaking in 2011. Today's price hovers above $1.00/lb.
Coffee continues to express all sorts of weakness since peaking in 2011. Recent news suggests that coffee stores are flush (circa 2009) and prices are not expected to rebound anytime soon. The crop forecast for Brazil (producing 1/3 global supply) is also good into next harvest (mid-2014). Expectation by some traders is price will remain depressed until demand recovers, and may hit $100 before there are any substantial improvements in global price. (WSJ September 2013)
With prices as depressed as they have been, you would think that the price of a cup at your favorite outlet might adjust - though that depends on how much of a cup of coffee is affected by the price of the raw materials - which in many cases is not significant. The rise in price of energy (i.e., transportation, roasting, etc.) and other factors has likely offset any advantages from lower raw material costs. Another factor is that companies like Starbuck's negotiates their own coffee supply and prices through private contracts.
Watching and learning. Trading on.

Coffee continues to express all sorts of weakness since peaking in 2011. Recent news suggests that coffee stores are flush (circa 2009) and prices are not expected to rebound anytime soon. The crop forecast for Brazil (producing 1/3 global supply) is also good into next harvest (mid-2014). Expectation by some traders is price will remain depressed until demand recovers, and may hit $100 before there are any substantial improvements in global price. (WSJ September 2013)
With prices as depressed as they have been, you would think that the price of a cup at your favorite outlet might adjust - though that depends on how much of a cup of coffee is affected by the price of the raw materials - which in many cases is not significant. The rise in price of energy (i.e., transportation, roasting, etc.) and other factors has likely offset any advantages from lower raw material costs. Another factor is that companies like Starbuck's negotiates their own coffee supply and prices through private contracts.
Watching and learning. Trading on.
Tuesday, October 22, 2013
COFFEE: A global consumer staple?
Presented below are a weekly price charts for Coffee. And a daily chart of ICE - SPOT price and JO (Coffee ETF) (Breakpointtrades.com). Not yet at historical lows, and volume pattern is negative. Worthy of placing to the Watch List.


Sunday, October 20, 2013
Saturday, October 19, 2013
UPDATED: October 23, 2013 Another look at WTI XOIL
UPDATED: October 23, 2013 > Crude has expressed considerable weakness and has broken through previous resistance > next resistance at $93-94/bbl - watching and learning.

I have been part of conversations in the last couple of months where the price of oil has been the topic. In Calgary, this is a very important topic. Regardless of all efforts to 'diversify' the economy, the energy business is king. And when the king falters or advances, so does Calgary's momentum. I posted previously on a compressing triangle in the long term price of Crude (HERE). That pattern resolved cleanly and price has continued within its new pattern.
The noted conversations have included predictions of oil to crater completely from over supply, to spiking again from global tensions and potential for disruptions to supply. Technically, the price of oil at the moment is in the middle of a very large ascending triangle - that could resolve to a measured move of $45 > up to $160. To achieve that, $112 resistance has to give way > as well as exceeding previous record high @ $147. Alternately, if weakness in price continues as it has since August 2013 @ $112 > levels to watch include breaking decisively below $100 > breaking decisively below descending trendline / and consequently ascending trendline > and a lot of price volume around low $80's.
Downside breakouts are less rewarding and less likely to occur. Upside breakouts have higher reward and greater likelihood of achieve measured targets. Watching and learning. Trading On.


I have been part of conversations in the last couple of months where the price of oil has been the topic. In Calgary, this is a very important topic. Regardless of all efforts to 'diversify' the economy, the energy business is king. And when the king falters or advances, so does Calgary's momentum. I posted previously on a compressing triangle in the long term price of Crude (HERE). That pattern resolved cleanly and price has continued within its new pattern.
The noted conversations have included predictions of oil to crater completely from over supply, to spiking again from global tensions and potential for disruptions to supply. Technically, the price of oil at the moment is in the middle of a very large ascending triangle - that could resolve to a measured move of $45 > up to $160. To achieve that, $112 resistance has to give way > as well as exceeding previous record high @ $147. Alternately, if weakness in price continues as it has since August 2013 @ $112 > levels to watch include breaking decisively below $100 > breaking decisively below descending trendline / and consequently ascending trendline > and a lot of price volume around low $80's.
Downside breakouts are less rewarding and less likely to occur. Upside breakouts have higher reward and greater likelihood of achieve measured targets. Watching and learning. Trading On.

Friday, October 18, 2013
GOOG gaps UP Huge!
Quarterly results lead to a huge move from below $900 -> to over $1000/shr - BIG BIG day for GOOG (+13.83%).


Saturday, June 8, 2013
UPDATED 19-September-2013: EUR:USD > Pattern unfolding ~ Where to next?
UPDATE: September 19, 2013 > this pattern has been thoroughly broken at this point. A succesasion of higher highs, and higher lows suggests this is going higher. I had seen a headline yesterday that referenced 1.37 as a target. The short is gone - for now.

UPDATE 3-August-2013: Below is a daily chart of the EUR:USD. This pattern remains in play, however, as noted below - the longer these patterns play out without actually resolving in the anticipated manner - the lower their likelihood of doing so also goes. Interestingly, in this pattern, we now have a smaller HS pattern developing within the larger one. That might be prescient. But price must respond with a fairly dedicated fall to lower values. Watching and learning. Trading On.

UPDATE: July 21, 2013: Price hit a low of 1.275, and has pushed higher again, into the 1.31's, closing at 1.313 but rejected at 1.320 and pushed to a lower high the following day (1.317). While the pattern remains in place, the longer and less definitive the pattern becomes, the validity of it also erodes. Watching and learning.

UPDATE July 4 2013: MAX pain has been averted for now ~ lots of factors to phuk with this trade still ~ watching and learning, trading on!
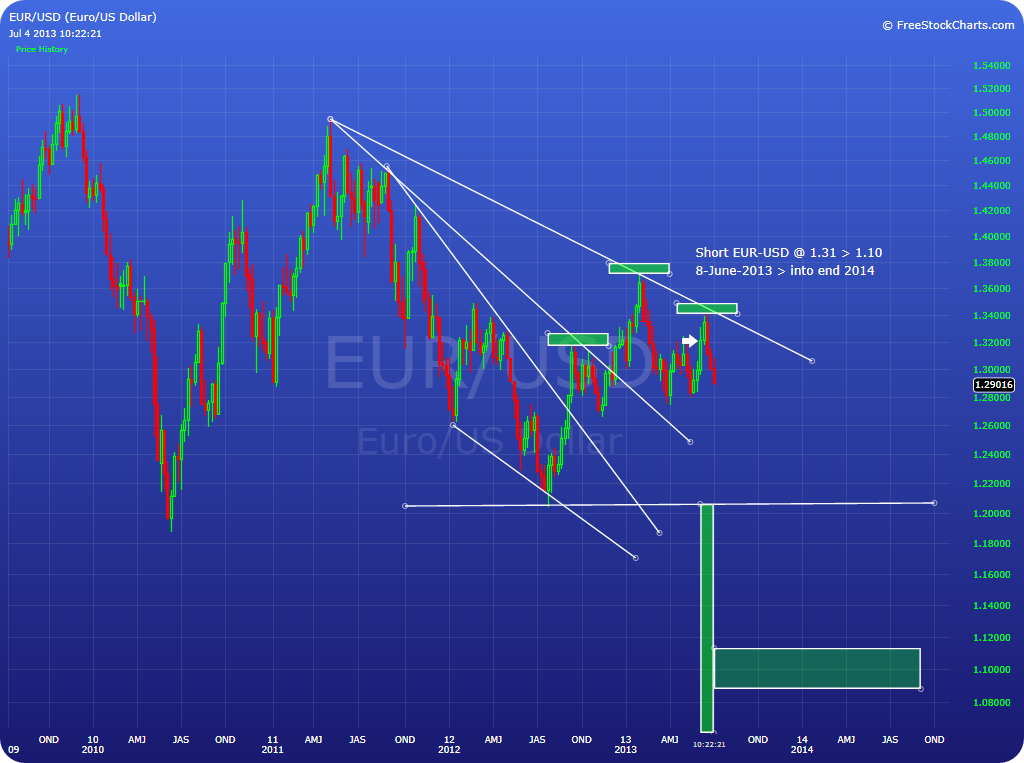
UPDATE: June 14, 2013
This trade has been going in the opposite direction ~ 1.325 was a horizontal barrier ~ currently at 1.334 ~ it will be interesting if the strength continues and whether or not the trend line offers any resistance. Watching and Learning. Trading On.

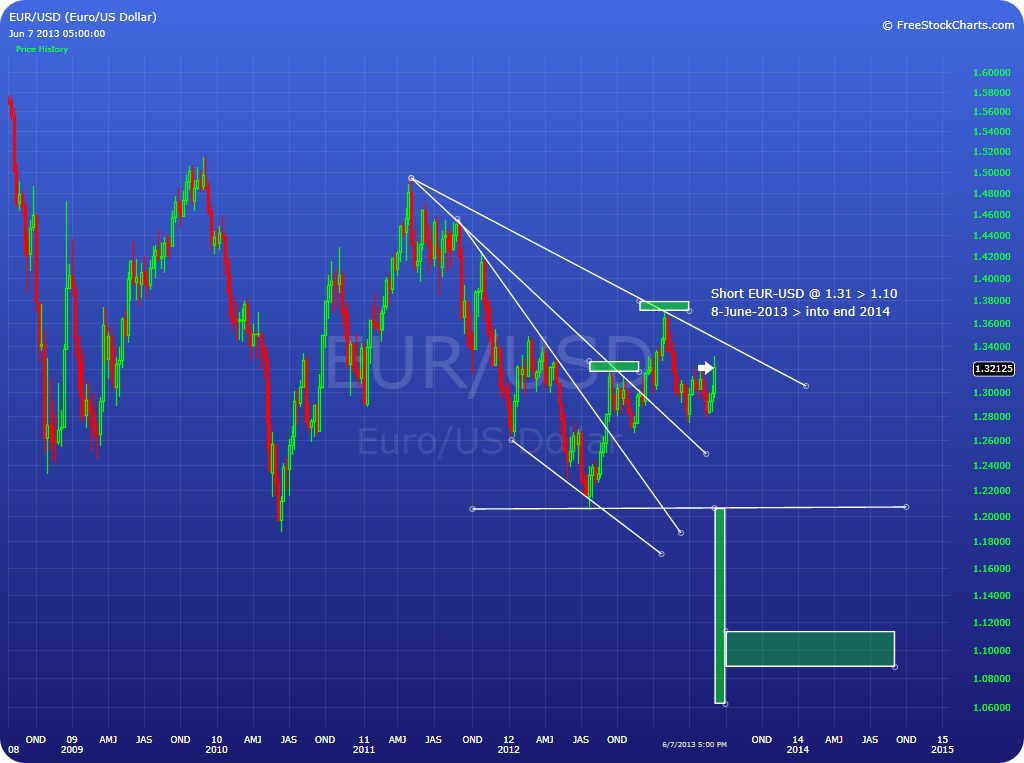
I was listening to a radio show this morning @moneytalks.net. Specifically, the commentary of a guest on the show interested me. The view presented was that the USD will again strengthen considerably, and the guest's view forward included a severe change in the EUR:USD relationship.
Looking at a weekly chart, there is a large H&S (~ July 2012) pattern developing. With the guest comments including a potential low of EUR:USD@1.10 > this is a plausible scenario. The common themes to this position are the central bank and related government policies and actions, the resultant public and private debt and deficit scenarios, and the belief that this cannot be perpetuated.
If my trading has taught me anything ~ everything, every scenario, every instance, every event ~ has a probability. And generally the smallest probabilities have the largest consequences. Know your consequences, and execute your trade according to your limits.
It's not what happens but what happens next that is important. Watching and learning. Trading On ~
Subscribe to:
Posts (Atom)