
Friday, October 18, 2013
GOOG gaps UP Huge!
Quarterly results lead to a huge move from below $900 -> to over $1000/shr - BIG BIG day for GOOG (+13.83%).


Saturday, June 8, 2013
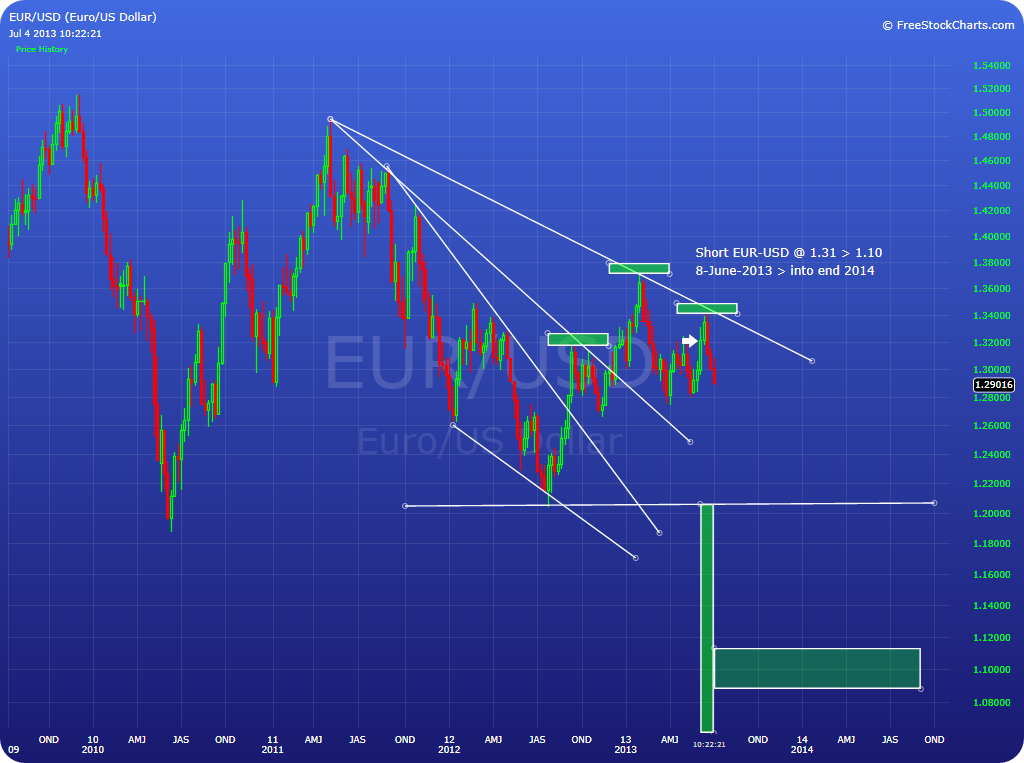
UPDATED 19-September-2013: EUR:USD > Pattern unfolding ~ Where to next?
UPDATE: September 19, 2013 > this pattern has been thoroughly broken at this point. A succesasion of higher highs, and higher lows suggests this is going higher. I had seen a headline yesterday that referenced 1.37 as a target. The short is gone - for now.

UPDATE 3-August-2013: Below is a daily chart of the EUR:USD. This pattern remains in play, however, as noted below - the longer these patterns play out without actually resolving in the anticipated manner - the lower their likelihood of doing so also goes. Interestingly, in this pattern, we now have a smaller HS pattern developing within the larger one. That might be prescient. But price must respond with a fairly dedicated fall to lower values. Watching and learning. Trading On.

UPDATE: July 21, 2013: Price hit a low of 1.275, and has pushed higher again, into the 1.31's, closing at 1.313 but rejected at 1.320 and pushed to a lower high the following day (1.317). While the pattern remains in place, the longer and less definitive the pattern becomes, the validity of it also erodes. Watching and learning.

UPDATE July 4 2013: MAX pain has been averted for now ~ lots of factors to phuk with this trade still ~ watching and learning, trading on!
UPDATE: June 14, 2013
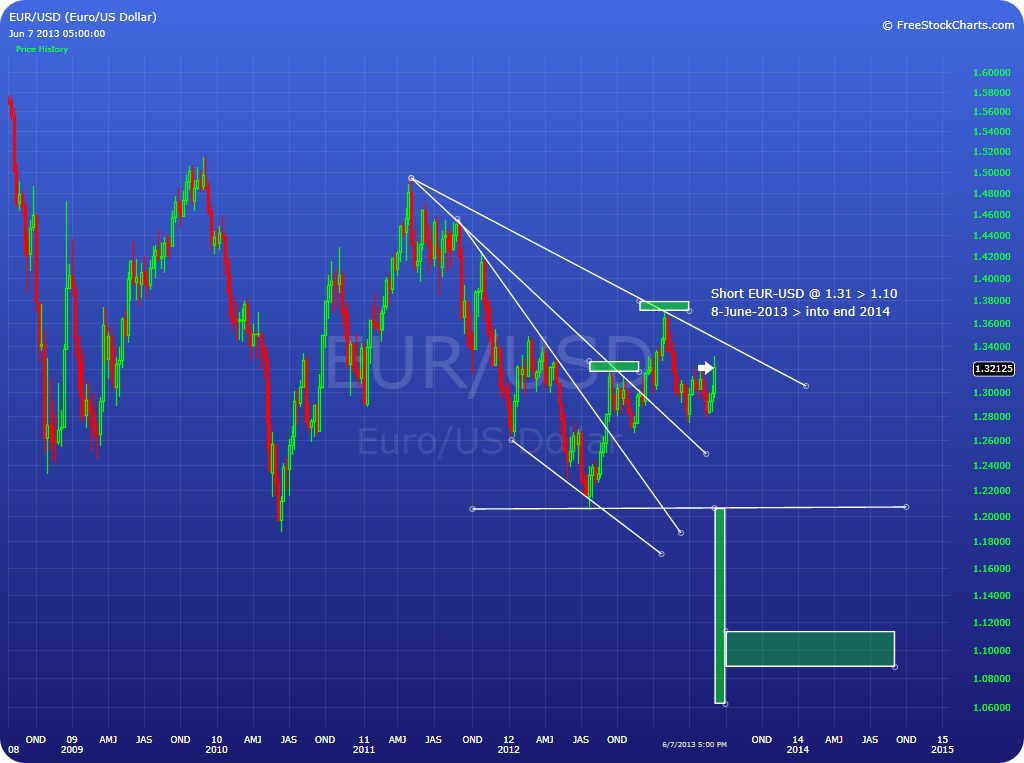
This trade has been going in the opposite direction ~ 1.325 was a horizontal barrier ~ currently at 1.334 ~ it will be interesting if the strength continues and whether or not the trend line offers any resistance. Watching and Learning. Trading On.

I was listening to a radio show this morning @moneytalks.net. Specifically, the commentary of a guest on the show interested me. The view presented was that the USD will again strengthen considerably, and the guest's view forward included a severe change in the EUR:USD relationship.
Looking at a weekly chart, there is a large H&S (~ July 2012) pattern developing. With the guest comments including a potential low of EUR:USD@1.10 > this is a plausible scenario. The common themes to this position are the central bank and related government policies and actions, the resultant public and private debt and deficit scenarios, and the belief that this cannot be perpetuated.
If my trading has taught me anything ~ everything, every scenario, every instance, every event ~ has a probability. And generally the smallest probabilities have the largest consequences. Know your consequences, and execute your trade according to your limits.
It's not what happens but what happens next that is important. Watching and learning. Trading On ~
Sunday, February 24, 2013
UPDATED: US Dollar ~ DXY0 ~ Channelized, but where to next? (August 3, 2013)
There has been considerable talk about the US$ and its recent strength. The dollar is within a BAR (Big-Ass-Range that extends from 76 < > 86 ~ what's next? There is also a strong sentiment that the US economy is improving, fundamentals are showing that there is sustainable strength < > Really? My trading style sees price being in the middle of a range and therefore has the potential to go either way, while there is some reasonable and credible evidence for either direction. Below are a Daily and Weekly Chart for the DXY0 ~ Watching and Learning
UPDATED August 3, 2013: the channelized price pattern has continued to play out as might be anticipated. Price remains within the previous range. Of note, price made a higher low and would suggest strength could be next. Watching and learning. Trading On.

UPDATED 16-June-2013: The daily and weekly charts below continue to tell a familiar story. The USD remains channelized, though I adjusted the upper bound to more reflect reality. At its current position, relatively difficult to assign a good probability on a move ~ expressed weakness has been exhibited since late May.


UPDATED: Price has stalled and oscillated here. On the daily chart price has broken up and back down numerous times across this trend line - and even gapped up over it on March 18. Since then price has fallen back to the line and rebounded higher again, only to retreat again. Possibly a precursor to a more powerful move. However, the last price action was decidedly weaker, and while closing above, had penetrated below the last low. Watching and Learning.

UPDATED: Potential new right shoulder?


Saturday, February 2, 2013
NatGas: Futures, ETFs and Options - Where to next?

NYMEX Natural gas futures have essentially flatlined since the dramatic drop from the highs achieved in 2007-08 close to $14/mmBtu. Investment in Shale gas and natural gas assets continues make headlines. The world is awash in supply of natural gas, and climate change is not helping matters - though the added expectations of air quality management and omnipresent air conditioning is also a factor. BElow are two alternate investment vehicles, an ETF and Options path for NatGas investments. I also follow Encana. The small green arrow points to when Randy Eresman stepped down. Does NatGas have a strong future? Watching and Learning.


NGX - The Natural Gas Index is designed to measure the performance of highly capitalized companies in the natural gas industry involved primarily in natural gas exploration and production and natural gas pipeline transportation and transmission.

Wednesday, January 16, 2013
UPDATE2: VIX Weekly Chart
VIX (Volatility Index) has fallen below a rather significant trend line. As noted, this has happened numerous times in the last 4+yrs since the 07-08 market moves. What does it mean? Maybe nothing, but certainly a circumstance worth monitoring. Should VIX continue below this trend line, the markets may tend to remain strong and positive. Watching and Learning.
UPDATE2: VIX has rebounded and penetrated the 'gap' and retreated back to the trend line. What is next? A surge to close the 'gap'? A retest of the trend and exploding up after a recent higher high? OR break back down and make another new lower low? OR meander along this trend line for a while? Continuing with Watching and Learning.

UPDATE (Jan 19, 2013): two factors have emerged - there has been decisive movement below the trend line including back tracing and there is a large 'gap' above that might have to be filled at some time.
Dec 22, 2006 VIX hit a low of 8.46. Watching and learning.


Wednesday, January 9, 2013
UPDATE(2): Messy IHS measuring 100+ pts? SPX Hourly chart
UPDATE 3: This pattern has pretty much failed though with the current euphoria and mis-allocated capital, who the heck knows! Was crawling along the top then broke below the trend line.

UPDATE (2): The 'messy' IHS has continued, and looks less likely of following through, however, that potential remains a possibility. Watching and Learning.

UPDATE:

ORIGINAL POST:

Sunday, December 23, 2012
UPDATED: BKX (Bank Index Fund)
UPDATE April 27, 2013
I had anticipated that the bank index would break down to the purple oval and green arrow (HERE is earlier post). Didn't work out that way, and the continued strength in this bank index is somewhat confounding - the banks do not appear to be feeling the brunt of the ever increasing debt bomb - and there are those that think they won't. Current price action has resistance just below $60/shr ~ As always - watching and learning.

UPDATED (13-1-2013)
The strength above previous resistance suggests this index might be ready for a big move. One strategy could be to take a small position, then wait and see whether or not it tests the line for support from the opposite side. Watching and Learning.
I had an early expectation that by August 2012 the banks will have been crushed under the over-leverage and infinite interconnectedness ~ hasn't happened ~ the banks have continued on a fairly stable path though the compressed wedge boundaries are now a possible influence. Watching and Learning.
+next+step.png)
.png)
Subscribe to:
Posts (Atom)